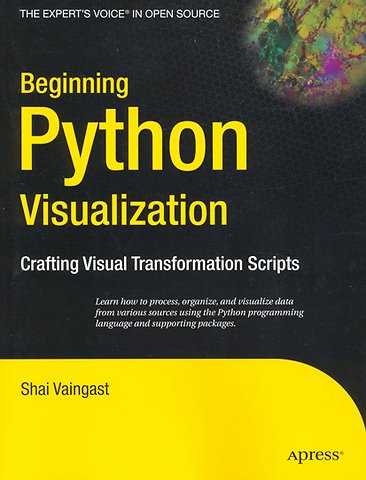
Beginning Python Visualization: Crafting Visual Transformation Scripts
Samenvatting
We are visual animals. But before we can see the world in its true splendor, our brains, just like our computers, have to sort and organize raw data, and then transform that data to produce new images of the world. 'Beginning Python Visualization: Crafting Visual Transformation Scripts' talks about turning many types of small data sources into useful visual data. And you will learn Python as part of the bargain.
What you'll learn:
- Write ten lines of code and present visual information instead of data soup.
- Set up an open source environment ready for data visualization.
- Forget Excel: use Python.
- Learn numerical and textual processing.
- Draw graphs and plots based on textual and numerical data.
- Learn how to deal with images.
Who is this book for?
IT personnel, programmers, engineers, and hobbyists interested in acquiring and displaying data from the Web, sensors, economic trends, and even astronomical sources.
Specificaties
Inhoudsopgave
About the Technical Reviewer
Acknowledgments
Introduction
1. navigating the World of data Visualization
2. The environment
3. Python for Programmers
4. data Organization
5. Processing Text Files
6. Graphs and Plots
8. Science and Visualization
9. image Processing
10. advanced File Processing
Appendix: additional Source Listing
Index
Anderen die dit boek kochten, kochten ook
Net verschenen
Rubrieken
- aanbestedingsrecht
- aansprakelijkheids- en verzekeringsrecht
- accountancy
- algemeen juridisch
- arbeidsrecht
- bank- en effectenrecht
- bestuursrecht
- bouwrecht
- burgerlijk recht en procesrecht
- europees-internationaal recht
- fiscaal recht
- gezondheidsrecht
- insolventierecht
- intellectuele eigendom en ict-recht
- management
- mens en maatschappij
- milieu- en omgevingsrecht
- notarieel recht
- ondernemingsrecht
- pensioenrecht
- personen- en familierecht
- sociale zekerheidsrecht
- staatsrecht
- strafrecht en criminologie
- vastgoed- en huurrecht
- vreemdelingenrecht


