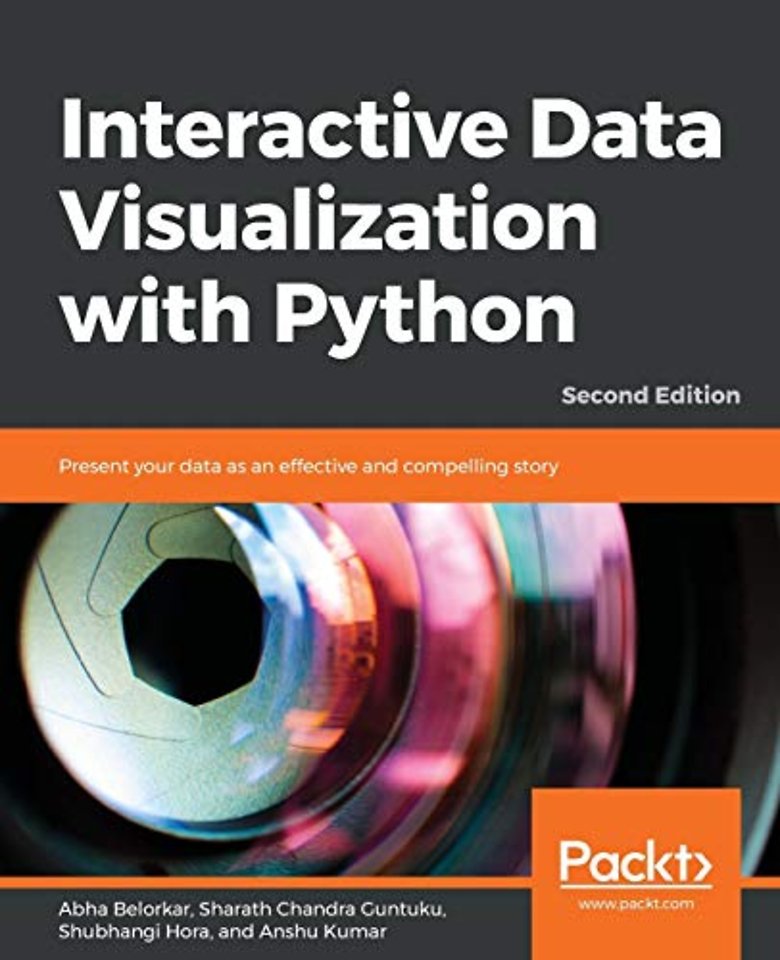
Data Visualization with Python
Create an impact with meaningful data insights using interactive and engaging visuals
Samenvatting
- Explore and apply different interactive data visualization techniques
- Manipulate plotting parameters and styles to create appealing plots
- Customize data visualization for different audiences
- Design data visualizations using interactive libraries
- Use Matplotlib, Seaborn, Altair and Bokeh for drawing appealing plots
- Customize data visualization for different scenarios
With so much data being continuously generated, developers, who can present data as impactful and interesting visualizations, are always in demand. Interactive Data Visualization with Python sharpens your data exploration skills, tells you everything there is to know about interactive data visualization in Python.
You'll begin by learning how to draw various plots with Matplotlib and Seaborn, the non-interactive data visualization libraries. You'll study different types of visualizations, compare them, and find out how to select a particular type of visualization to suit your requirements. After you get a hang of the various non-interactive visualization libraries, you'll learn the principles of intuitive and persuasive data visualization, and use Bokeh and Plotly to transform your visuals into strong stories. You'll also gain insight into how interactive data and model visualization can optimize the performance of a regression model.
By the end of the course, you'll have a new skill set that'll make you the go-to person for transforming data visualizations into engaging and interesting stories.
Features
- Study and use Python interactive libraries, such as Bokeh and Plotly
- Explore different visualization principles and understand when to use which one
- Create interactive data visualizations with real-world data
Specificaties
Inhoudsopgave
2. Static Visualization – Global Patterns and Summary Statistics
3. From Static to Interactive Visualization
4. Interactive Visualization of Data across Strata
5. Interactive Visualization of Data across Time
6. Interactive Visualization of Geographical Data
7. Avoiding Common Pitfalls to Create Interactive Visualizations
Anderen die dit boek kochten, kochten ook
Net verschenen
Rubrieken
- aanbestedingsrecht
- aansprakelijkheids- en verzekeringsrecht
- accountancy
- algemeen juridisch
- arbeidsrecht
- bank- en effectenrecht
- bestuursrecht
- bouwrecht
- burgerlijk recht en procesrecht
- europees-internationaal recht
- fiscaal recht
- gezondheidsrecht
- insolventierecht
- intellectuele eigendom en ict-recht
- management
- mens en maatschappij
- milieu- en omgevingsrecht
- notarieel recht
- ondernemingsrecht
- pensioenrecht
- personen- en familierecht
- sociale zekerheidsrecht
- staatsrecht
- strafrecht en criminologie
- vastgoed- en huurrecht
- vreemdelingenrecht


