

Ben Jones is an award winning Tableau Public author, and is also the Tableau Public product marketing manager at Tableau Software in Seattle, WA.
Meer over Ben JonesCommunication Data with Tableau
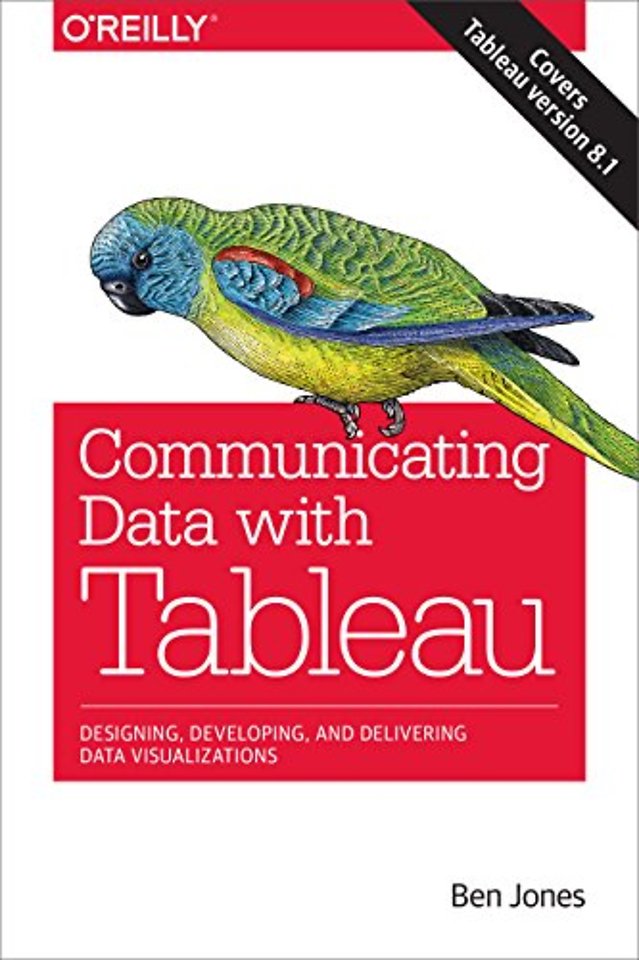
Designing, Developing, and Delivering Data Viisualizations (Covers Tableau version 8,.1)
Samenvatting
Go beyond spreadsheets and tables and design a data presentation that really makes an impact. This practical guide shows you how to use Tableau Software to convert raw data into compelling data visualizations that provide insight or allow viewers to explore the data for themselves.
Ideal for analysts, engineers, marketers, journalists, and researchers, this book describes the principles of communicating data and takes you on an in-depth tour of common visualization methods. You’ll learn how to craft articulate and creative data visualizations with Tableau Desktop 8.1 and Tableau Public 8.1.
- Present comparisons of how much and how many
- Use blended data sources to create ratios and rates
- Create charts to depict proportions and percentages
- Visualize measures of mean, median, and mode
- Lean how to deal with variation and uncertainty
- Communicate multiple quantities in the same view
- Show how quantities and events change over time
- Use maps to communicate positional data
- Build dashboards to combine several visualizations
Specificaties
Inhoudsopgave
U kunt van deze inhoudsopgave een PDF downloaden
1. Communicating Data
-Appendix Step in the Process
-Appendix Model of Communication
-Three Types of Communication Problems
-Six Principles of Communicating Data
-Summary
2. Introduction to Tableau
-Using Tableau
-Tableau Products
-Connecting to Data
3. How Much and How Many
-Communicating “How Much”
-Communicating “How Many”
-Summary
4. Ratios and Rates
-Ratios
-Rates
-Summary
5. Proportions and Percentages
-Part-to-Whole
-Current-to-Historical
-Actual-to-Target
-Summary
6. Mean and Median
-The Normal Distribution
-Summary
7. Variation and Uncertainty
-Respecting Variation
-Variation Over Time: Control Charts
-Understanding Uncertainty
-Summary
8. Multiple Quantities
-Scatterplots
-Stacked Bars
-Regression and Trend Lines
-The Quadrant Chart
-Summary
9. Changes Over Time
-The Origin of Time Charts
-The Line Chart
-The Dual-Axis Line Chart
-The Connected Scatterplot
-The Date Field Type and Seasonality
-The Timeline
-The Slopegraph
-Summary
10. Maps and Location
-One Special Map
-Circle Maps
-Filled Maps
-Dual-Encoded Maps
-Summary
11. Advanced Maps
-Maps with Shapes
-Maps Showing Paths
-Plotting Map Shapes Using Axes
-Summary
12. The Joy of Dashboards
-Dashboards in Tableau
-A Word of Caution
-Types of Dashboards
-Summary
13. Building Dashboards
-Building an Exploratory Dashboard
-Building an Explanatory Dashboard
-Summary
14. Advanced Dashboard Features
-Animating Dashboards
-Showing Multiple Tabs
-Adding Navigation with Filters
-Adding Custom Header Images
-Adding Google Maps to Dashboards
-Adding YouTube Videos to Dashboards
-Summary
Appendix Resources
Index
Anderen die dit boek kochten, kochten ook
Net verschenen
Rubrieken
- aanbestedingsrecht
- aansprakelijkheids- en verzekeringsrecht
- accountancy
- algemeen juridisch
- arbeidsrecht
- bank- en effectenrecht
- bestuursrecht
- bouwrecht
- burgerlijk recht en procesrecht
- europees-internationaal recht
- fiscaal recht
- gezondheidsrecht
- insolventierecht
- intellectuele eigendom en ict-recht
- management
- mens en maatschappij
- milieu- en omgevingsrecht
- notarieel recht
- ondernemingsrecht
- pensioenrecht
- personen- en familierecht
- sociale zekerheidsrecht
- staatsrecht
- strafrecht en criminologie
- vastgoed- en huurrecht
- vreemdelingenrecht


